Solutions
Applying user-centered design to create accessible, visually appealing digital data solutions and products
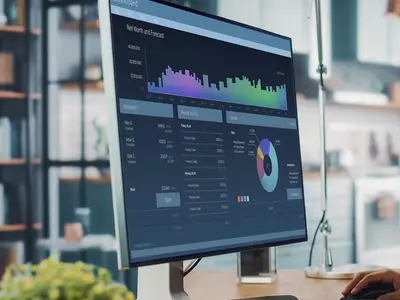
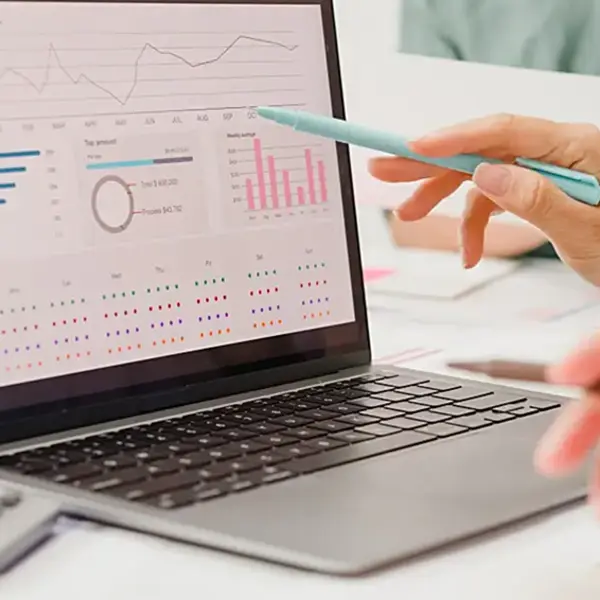
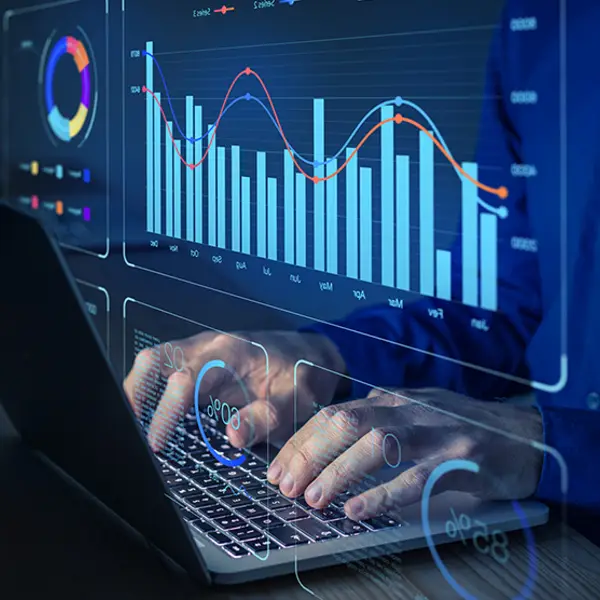
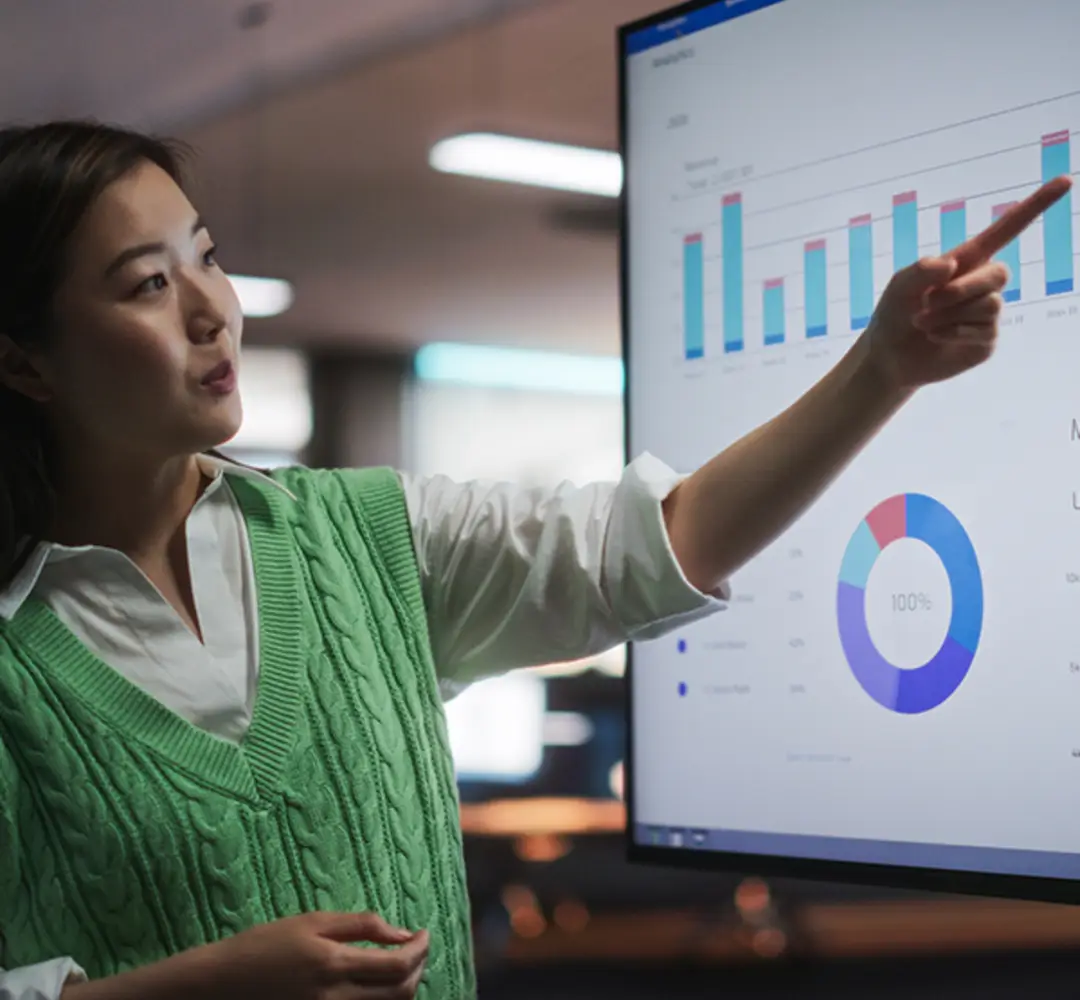
As data continue to become more complex, data visualization solutions are needed to transform them into clear, actionable insights. Intuitive interfaces and real-time, customizable data visualizations can be leveraged to alleviate real-time challenges and help data users make informed decisions faster.
RTI International uses a collaborative design approach that tailors the end product to the nuances and technical requirements of source data and to specific communication objectives. Our team of experienced data visualization experts shepherd this work from start to finish, including initial requirements gathering, design drafts, user testing, publication, and ongoing maintenance. We create interactive data visualizations, dashboards, and reports that not only meet the highest standards of usability and clarity but are also secure, accessible, and responsive.
Expertise Across the Spectrum of Tools and Data Visualization Solutions
Choosing the right tool is essential for shaping the usability and accessibility of the end product. RTI experts have proficiencies in the full domain of data visualization tools, including
- no-code data visualization software, such as Tableau and PowerBI;
- low-code data science web frameworks, such as Dash, Streamlit, and R-Shiny; and
- fully custom web applications built using open-source technologies, such as RTI’s Harness-Vue tools.
This wide range of skillsets ensures that we can tailor our solutions to the unique needs and challenges of each project.
User-Centered Design (UCD) Philosophy for Effective Data Visualization Solutions
RTI leverages a UCD philosophy for creating data visualization solutions that integrate UCD principles with subject matter expertise in communication theory, data science, and design.
Through this approach, we work hand-in-hand with our clients to identify innovative data visualization solutions and data stories. Structuring products to combine focused exploration with rapid and iterative prototyping enables us to understand and solve user needs. By promoting divergent thinking that broadens perspectives and generates ideas, these data visualization tools can help users analyze, synthesize, and discern patterns in the data.
Using Progressive Data Analysis and Visualization Solutions
RTI’s visual data analysis lifecycle progresses through the following key stages:
- Exploratory data analysis. Visual analysts and data scientists work with key stakeholders and available and/or synthetic data to find the intersection of forecasted user need and data capability.
- Data visualization development and deployment. Robust, production-ready visualization tools are built and deployed by visual analysts and software developers.
- Progressive incrementation. Evolving data content, user needs, and real-world context and events drive change, new visualizations, and features, as well as improvements and revisions to existing visualizations.
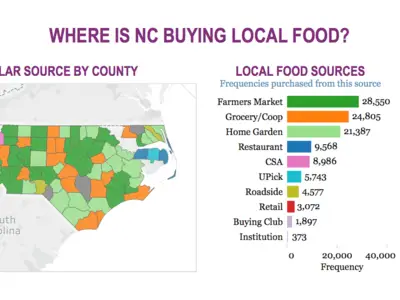
RTI has a proven track record of collecting, integrating, and analyzing a variety of datasets through this process, ultimately resulting in timely, up-to-date, and high impact visualization tools. Click here to learn about RTI’s full portfolio of user-focused tools and products—such as dashboards, reports, and portals—that transform complex data into actionable insights.
Featured Data Visualization Solutions


Related Projects
Featured Stories


Meet the Experts
View All Experts
Navigate to
Alex Harding

Alex Harding
Navigate to
Marcia Underwood

Marcia Underwood
Navigate to
Brandon Price

Brandon Price
Navigate to
Ian Thomas

Ian Thomas
Navigate to
Christopher Townsend

Christopher Townsend
Navigate to
Jason Schoeneberger

Jason Schoeneberger
Navigate to
Chelci D. Harris

Chelci D. Harris
Navigate to
Chloe Stephenson

Chloe Stephenson
Navigate to
Britta Hansen

Britta Hansen
Navigate to
Jennifer Cooney

Jennifer Cooney
Navigate to
Chris Johns

Chris Johns
Navigate to
Julia Chistiakova

Julia Chistiakova
Navigate to
Ben Tyndall