RTI Fovea™: A User-friendly Method to Identify Outliers

Outlier detection is a critical task across fields and industries. However, conventional univariate outlier detection methods can produce misleading results when the target of interest is outlier behavior. Why? Confounding factors can make individuals or organizations appear to have “normal” values when they are in fact engaged in anomalous behavior, and vice versa. Furthermore, analyses that only search for outliers on a single outcome do not provide the richness needed to capture the complexity of human or organizational behavior. Addressing these methodological challenges is vital in, for example, research and program administration where outlier analysis is often used to monitor for gaming behavior, particularly when financial awards or other incentives are at stake.
To meet these challenges, RTI Fovea™ is a generalized outlier behavior detection tool that leverages machine learning to help users identify multidimensional conditional outliers and more quickly detect subtle trends, limit malfeasance, learn lessons from star performers, and better inform policy or investment decisions.

Compared with conventional outlier analysis, Fovea empowers users with a more robust and sophisticated approach for flagging anomalous behavior by controlling for confounding variables and allowing users to analyze multiple outcomes simultaneously.
For example, consider an organization whose measured outcome does not fall in the tail of the distribution of all organizations nationwide, and thus would not be identified as an outlier using conventional methods. However, this organization may also differ from most other organizations on important characteristics that are independently associated with the measured outcome. For example, the organization could be located in a geographic market where all organizations in that area have higher measured outcomes, or the organization’s size could be strongly correlated with the outcome of interest. Controlling for key confounders allows for apples-to-apples comparisons with otherwise similar organizations when identifying outliers. Through this more robust approach, the organization may then be flagged as highly anomalous when controlling for the organization’s geographic market and size. Fovea’s advantage is the ability to flag such multidimensional conditional outliers that would likely go undetected by naïve outlier analyses.
RTI Fovea’s underlying predictive model is a quantile forest version of the generalized random forest proposed by Athey, Tibshirani, and Wager,[1] although Fovea can be adapted to accommodate other predictive models. A key advantage of the generalized random forest model is that it allows for broad applications while remaining computationally efficient. Fovea then builds subject-specific predicted distributions for each signal variable and summarizes this information through an Outlier Index that quantifies how outlying each subject is relative to its predicted distributions.
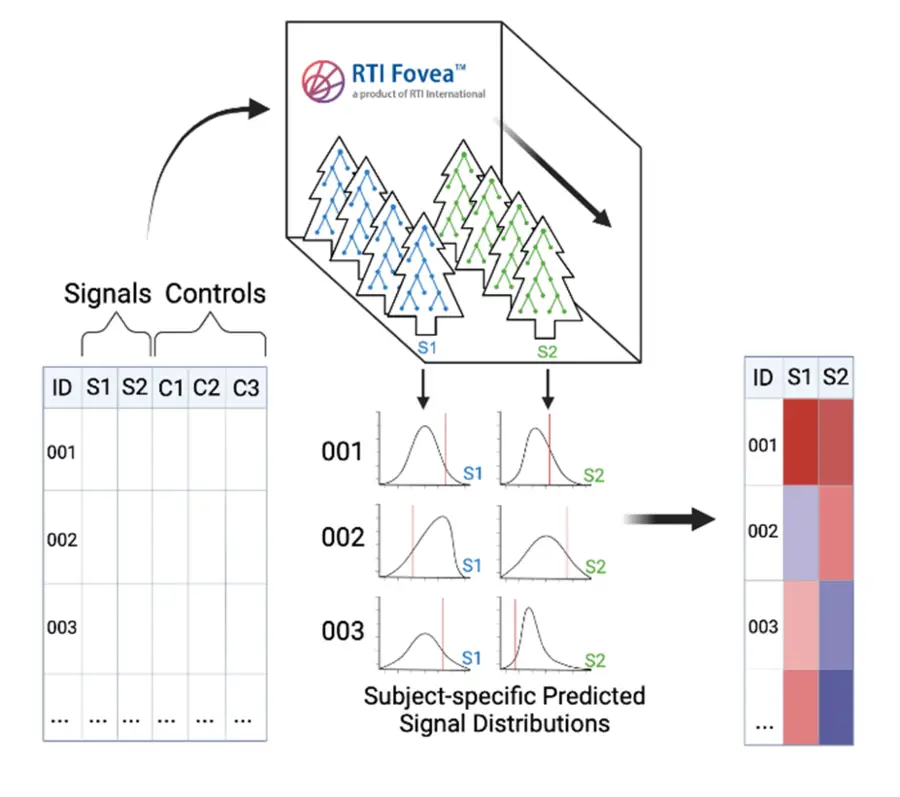
The RTI Fovea Conceptual Framework
This output helps generate Fovea’s suite of built-in visualizations and additional outlier metrics. These features allow users to easily identify individuals potentially engaged in anomalous behavior. Users who prefer to be more hands-on can directly access model outputs for additional analysis and visualization.

Visualization Features: Heat Map, Whisker Plots, and Histograms
While Fovea employs sophisticated methods that improve accuracy relative to conventional outlier analyses, its user-friendly design also represents a distinctive advantage. Users can easily input signal (i.e., outcome) and control variables to produce digestible outlier statistics and visualizations from day one. Using RTI Fovea often requires less stand-up time than more conventional outlier detection analyses.
Recognizing that outlier detection analyses are employed across a wide range of industries, RTI built Fovea’s architecture and interface to be highly generalizable. Examples of potential use cases include:
Contact us using the form below to see how RTI Fovea can be leveraged in your work and learn more about other AI tools that can help you analyze your data more accurately and efficiently.
[1] Athey, S., Tibshirani, J., and Wager, S. (2019). Generalized random forests. The Annals of Statistics, 47(2), 1148-1178.