Insights


Beginning in January 2025, the FDA began a series of actions to phase out artificial food dyes and rapidly approve natural alternatives. Required changes will be effective in 2027 and many industry and trade groups are taking voluntary actions to make changes sooner.
These policy shifts toward an artificial food dye ban—and many voluntary industry changes already underway—raise a practical question for public health and policy makers: who is buying products that contain artificial dyes today, and how large is the market that will be affected by these reforms?
To answer that, we turned to real-world retail scanner and household purchase data to create a clear baseline for understanding the rapidly evolving marketplace and the effect of these voluntary actions.
Importance of Data-Driven Decision-Making for Consumer Products Industry
For over two decades, the RTI Scanner Team has worked with retail scanner data across several consumer product categories, including tobacco, alcohol, and naloxone. Retail scanner data refers to data captured when a product with a universal product code (UPC) is scanned at the register. Our analyses have provided timely insights to regulators, implementing agencies, and other stakeholders about the effectiveness and impact of regulatory actions.
Rapid, high-quality surveillance of retail and household purchase data is essential to measure the equity and effectiveness of food-safety and nutrition policies.
If regulators and public-health advocates are to understand how changes in ingredients or labeling affect communities, they need granular, real-time evidence that shows not just what is on store shelves, but who is buying it—and at what cost. Robust surveillance allows decision-makers to spot disparities and design responses that protect vulnerable populations, including children.
RTI's Process to Analyze Artificial Food Dye Retail Sales and Household Purchases
Our team analyzed product-level sales across juice drinks (those with less than 100% fruit juice) and breakfast cereals from July 2023 to July 2025. We worked in partnership with a data provider and used our established and continually refined infrastructure for processing retail scanner data and nationally representative household purchase data.
We cross-referenced UPC-level data captured at the point of sale with ingredient information to classify which products contained any of the nine commonly used artificial dyes. We then analyzed which households purchased dye-containing products at higher rates.
Our findings demonstrate RTI’s ability to quickly mobilize resources to understand the pressing public health issue of artificial food dyes in consumer goods. Findings are being prepared for peer-review dissemination.
Key findings for Juice and Cereal Sales Among Households
- Products with artificial dyes make up a significant proportion of juice drink and cereal sales. Scanner data from July 2023 to July 2025 show that 31.2% of juice drink sales and 20.2% of cereal sales (standardized units) contained artificial dyes. Average monthly estimates were consistent over the past two years.
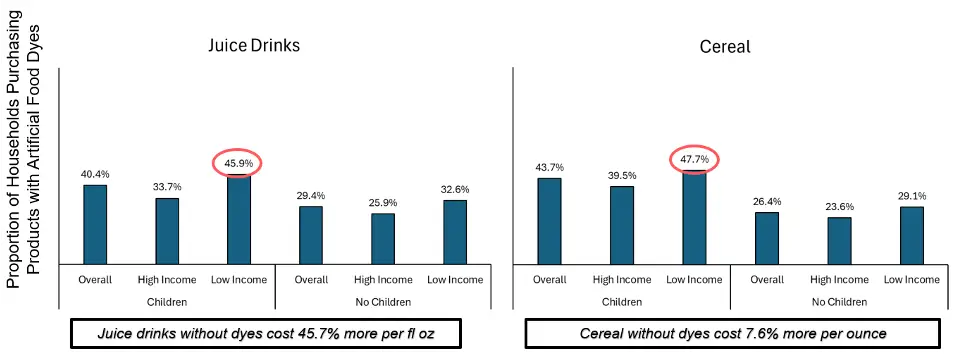
- Households with children purchase juice drinks and cereal containing artificial dyes at higher rates. Among US households with children in the home, 40.4% purchased juice drinks containing artificial food dyes (compared to 29.4% of households without children in the home) and 43.7% purchased cereal containing artificial food dyes (compared to 26.4% of households without children in the home). Households with the highest rates of purchasing food-dye containing juice drink and cereal were those that had children and lower income (45.9% and 47.7%, respectively) while households without children and higher income exhibited the lowest rates of purchasing dye-containing juice drinks (25.9%) and cereal (23.6%). This pattern suggests that any benefits or risks associated with reduced dye exposure may not be shared equally across the population.
- Products with artificial dyes are less expensive. On average, compared to dye-free alternatives, dye-containing juice drinks were 45.7% less expensive per fluid ounce and dye-containing cereals were 7.6% less expensive per ounce—an important economic driver that makes dye-containing foods more accessible to budget-constrained families. Cost differences are a likely explanation for the observed purchase patterns and a policy lever to consider.
Why Studies on Artificial Food Dyes and Purchasing Trends Matter
Study findings inform risk communication, regulatory impact assessment, and equitable policy design. If dye-containing items are concentrated in lower-cost product lines and in households with children, then reform or substitution strategies that raise prices could unintentionally burden families already stretched financially.
Conversely, voluntary manufacturer reformulation might reduce disparities—if reformulated products retain affordability and consumer appeal.
Limitations to This Artificial Food Dye Study
Retail sales and household purchase data provide powerful, near-real-time signals about market behavior, but they do not measure individual consumption or clinical outcomes.
In addition, labeling and ingredient databases can lag product changes, so ongoing data refreshes are important. Finally, while our analysis shows differences by household characteristics, it does not by itself prove causation.
RTI Provides Rapid Insights on Food Supply and Demand
The food landscape is rapidly evolving. Major manufacturers, like General Mills and Conagra Brands, are voluntarily reformulating products to remove artificial food dyes, ahead of regulatory deadlines. Regulators and other stakeholders need timely data on changes in product supply and consumer demand.
Our study provides baseline data for monitoring changes associated with regulatory and voluntary changes around food dyes – demonstrating RTI’s readiness to provide rapid insights to decision makers. RTI’s infrastructure, analytic capabilities, and long-standing partnership with data vendors, like NielsenIQ, uniquely position us to:
- Track trends in sales and purchases corresponding to product reformulations and labeling requirements,
- Quantify the impacts of food policies and regulations across populations and geographies, and
- Evaluate intended and unintended outcomes associated with voluntary and regulatory changes.
Contact us to explore collaborative opportunities and smart data solutions
Disclaimer: This piece was written by Doris G. Gammon (Senior Public Health Scientist and Program Manager), Erik Crankshaw (Senior Program Director, Policy & Regulatory Science), and Lindsay Olson (Public Health Analyst) to share perspectives on a topic of interest. Expression of opinions within are those of the author or authors.