Insights


Background: Most Favored Nation (MFN) Payment Model and International Drug Pricing
With the prospect of a possible “Most Favored Nation” (MFN) payment model on the horizon once again, RTI International estimated the potential impact under the rescinded Center for Medicare and Medicaid Innovation (CMMI) MFN model to provide insight into the scope of potential MFN pricing as a result of the Executive Order on prescription drug pricing. In particular, we estimated savings in Medicare Part B Fee-for-Service (FFS) drug spending if the 50 Part B drugs identified under the rescinded MFN model had been subject to MFN payment amounts during the initial model implementation year of 2021. International reference pricing under the Executive Order may also apply to self-administered drugs covered under Medicare Part D as well as non-Medicare markets. However, given the uncertainties related to implementation and enforcement, we focused our analysis on the Part B drug market to present a conservative estimate of the impact of international reference pricing.
Findings: Medicare Part B Fee-for-Service Drug Spending Under MFN Pricing
Based on our estimates, MFN pricing for Medicare Part B drugs would have resulted in over $3.8B in savings (9.5% of Part B drug spending in 2021), with actual Medicare spending averaging nearly 17% higher than simulated Medicare spending under MFN. 12 of the 50 MFN drugs would have individually contributed at least 2.5% of the MFN savings, and combined, would have represented nearly 75% of the total savings. These drugs were primarily comprised of antineoplastic drugs (including PD-1/PD-L1 agents Keytruda, Opdivo, and Tecentriq) and immunosuppressants.
Data and Methods: CMMI MFN Model, CMS Drug Pricing Data, and International Reference Pricing
Our analysis focused on the set of 50 Part B drugs, identified by Healthcare Common Procedure Coding System (HCPCS) codes, that were considered for MFN pricing in the rescinded CMMI MFN model; these drugs were selected by the Centers for Medicare & Medicaid Services (CMS) because they represented a large percentage of Medicare Part B spending. We also used the MFN payment amounts that CMS had determined for the first quarter of the model, which were a blended rate of (1) the drug’s Average Sales Price (ASP) and (2) the lowest gross domestic product (GDP)-adjusted price paid by an Organisation for Economic Co-operation and Development (OECD) member country with a GDP per capita that was at least 60% of the U.S. GDP per capita.
Methodology for Estimating Medicare Spending Under MFN Pricing
To simulate Medicare spending under MFN pricing, we used Medicare Part B FFS outpatient, carrier, and durable medical equipment claims for calendar year 2021[1] and applied the same claims restrictions as the original MFN model.[2] We estimated potential Medicare spending under MFN pricing by multiplying the claim line-reported units for each MFN drug’s HCPCS code by the drug’s MFN payment amount. We then applied the flat per-dose MFN add-on amount of $148.73.[3]
To calculate actual Medicare spending in the absence of MFN, we repriced the Part B claims for the MFN drugs using the 2021 quarterly ASP pricing files. To do so, we multiplied the units on the claim line by the HCPCS code’s ASP payment limit from the quarterly pricing file corresponding to the claim’s service date. We did not use the claim-reported Medicare allowed amount directly because Medicare providers are typically, but not always, reimbursed using the ASP payment limit for Part B drugs.[4] Using the allowed amount from the claims would have potentially included pricing adjustments not reflected in the estimates of Medicare spending under MFN pricing, preventing an apples-to-apples comparison.
Calculating Savings and Comparing to Total Part B Drug Spending
We then calculated the difference between actual Medicare spending (based on the ASP payment limit) and spending based on the MFN payment amount plus add-on to estimate savings from MFN pricing. We stratified the results by individual drug and drug class.[5] We also compared our savings estimates to total Medicare Part B drug spending using the 2021 CMS Part B drug spending dashboard. Finally, for the drugs comprising the largest share of total savings, we also examined how Medicare Part B spending compared to the manufacturer’s total sales for the drug, both domestic and international, using manufacturers’ publicly available annual financial reports (i.e., 10-K filings).
Limitations of MFN Pricing and Behavioral Impacts
As a caveat, our analysis does not account for potential behavioral impacts from MFN pricing, such as utilization shifts due to changes in beneficiary demand or access, or possible changes in provider responses in prescribing preferences.
Estimated Savings: MFN Pricing Impact on Medicare Part B Drugs and Prescription Drug Spending
Table 1 shows drug-level detail on estimated Medicare savings for the 12 MFN drugs that collectively would have represented nearly 75% of total savings resulting from MFN payment model. The table reports the count of utilizing beneficiaries, actual Medicare spending based on the ASP payment limit, the simulated Medicare spending under MFN, and the percentage change in spending between actual and simulated.
| MFN Drug Name (HCPCS Code) | Anatomical Therapeutic Chemical Level 2 | Count of Utilizing Beneficiaries | Total Actual Medicare Spending Based on ASP Payment Limit | Total Medicare Spending Based on MFN Payment Amount[a] + Add-On | % Change in Spending (Actual – MFN) |
|---|---|---|---|---|---|
| KEYTRUDA (J9271) | Antineoplastic Agents | 58,432 | $3,967,860,779 | $3,270,433,513 | 21.3% |
| EYLEA (J0178) | Immunosuppressants | 298,673 | $3,325,273,046 | $2,932,433,808 | 13.4% |
| OPDIVO (J9299) | Antineoplastic Agents | 23,262 | $1,537,366,189 | $1,202,928,394 | 27.8% |
| PROLIA/XGEVA (J0897) | Bone Disease Drugs | 607,792 | $1,824,361,807 | $1,494,139,119 | 22.1% |
| RITUXAN (J9312) | Antineoplastic Agents | 34,793 | $772,956,079 | $598,907,495 | 29.1% |
| LUCENTIS/LUCENTIS PFS (J2778) | Ophthalmologicals | 110,492 | $1,009,023,067 | $852,648,858 | 18.3% |
| TECENTRIQ (J9022) | Antineoplastic Agents | 11,881 | $650,377,477 | $505,204,267 | 28.7% |
| OCREVUS (J2350) | Immunosuppressants | 11,997 | $668,851,513 | $524,474,569 | 27.5% |
| ENTYVIO (J3380) | Immunosuppressants | 15,416 | $561,715,332 | $433,569,909 | 29.6% |
| ALIMTA (J9305) | Antineoplastic Agents | 15,823 | $470,133,916 | $348,599,579 | 34.9% |
| Abatacept/ORENCIA/ORENCIA CLICKJECT (J0129) | Immunosuppressants | 30,686 | $996,625,838 | $883,236,735 | 12.8% |
| SANDOSTATIN LAR DEPOT (J2353) | Pituitary and Hypothalamic Hormones | 8,763 | $436,265,459 | $332,609,102 | 31.2% |
| Top 12 MFN Drugs | 1,168,161 | $16,220,810,500 | $13,379,185,349 | 21.2% | |
| Remaining MFN Drugs | 1,413,217 | $10,252,631,292 | $9,263,021,331 | 10.7% | |
| Total MFN Drugs | 2,407,375 | $26,473,441,792 | $22,642,206,680 | 16.9% |
[A] The MFN payment amount is based on a blend of 75% ASP and 25% MFN price in Q1 2021 and was trended forward to subsequent quarters using the CY2021 observed weighted ASP trend.
Table 2 shows the estimated savings that would have resulted from MFN as a share of total MFN savings and relative to total Part B drug spending for all drugs in 2021.
| MFN Drug Name (HCPCS Code) | Anatomical Therapeutic Chemical Level 2 | Total Medicare Savings Resulting from MFN Payment Amount + Add-On | Savings as % of Total MFN Savings | Savings as % of Total Part B Drug Spending |
|---|---|---|---|---|
| KEYTRUDA (J9271) | Antineoplastic Agents | $697,427,266 | 18.2% | 1.7% |
| EYLEA (J0178) | Immunosuppressants | $392,839,238 | 10.3% | 1.0% |
| OPDIVO (J9299) | Antineoplastic Agents | $334,437,795 | 8.7% | 0.8% |
| PROLIA/XGEVA (J0897) | Bone Disease Drugs | $330,222,688 | 8.6% | 0.8% |
| RITUXAN (J9312) | Antineoplastic Agents | $174,048,584 | 4.5% | 0.4% |
| LUCENTIS/LUCENTIS PFS (J2778) | Ophthalmologicals | $156,374,209 | 4.1% | 0.4% |
| TECENTRIQ (J9022) | Antineoplastic Agents | $145,173,209 | 3.8% | 0.4% |
| OCREVUS (J2350) | Immunosuppressants | $144,376,943 | 3.8% | 0.4% |
| ENTYVIO (J3380) | Immunosuppressants | $128,145,423 | 3.3% | 0.3% |
| ALIMTA (J9305) | Antineoplastic Agents | $121,534,337 | 3.2% | 0.3% |
| Abatacept/ORENCIA/ORENCIA CLICKJECT (J0129) | Immunosuppressants | $113,389,102 | 3.0% | 0.3% |
| SANDOSTATIN LAR DEPOT (J2353) | Pituitary and Hypothalamic Hormones | $103,656,357 | 2.7% | 0.3% |
| Top 12 MFN Drugs | $2,841,625,151 | 74.2% | 7.1% | |
| Remaining MFN Drugs | $989,609,961 | 25.8% | 2.5% | |
| Total MFN Drugs | $3,831,235,112 | 100.0% | 9.5% |
Overall, actual Medicare spending for the MFN drugs totaled $26.4B, which represents about two-thirds of all Part B drug spending in 2021. MFN pricing for Medicare Part B drugs would have resulted in over $3.8B in savings (9.5% of Part B drug spending in 2021), with actual Medicare spending averaging nearly 17% higher than simulated Medicare spending under MFN, based on our estimates.
Several of the top 12 drugs would have had notable changes in actual Medicare spending compared to spending under MFN pricing. Actual Medicare spending would have been nearly 35% higher for Alimta and 29.6% higher for Entyvio; these drugs would have had larger differentials between ASP and MFN pricing relative to other top drugs, such as Orencia (12.8%) and Eylea (13.4%).
To provide insight into how much of the individual drug market would have been affected by MFN pricing, we also examined how actual Medicare Part B spending for the top 12 drugs compared to manufacturer sales in 2021 (Figure 1).
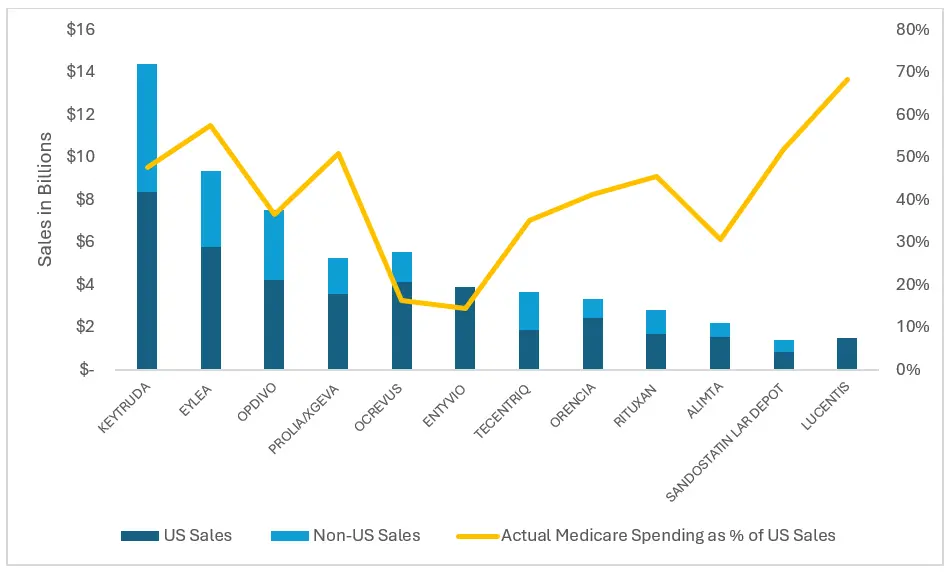
Figure 1. Actual Medicare Spending Compared to Manufacturer Sales, 2021
Notes: Orencia includes Abatacept and Orencia Clickjet; Lucentis includes Lucentis PFS. We did not find international sales numbers for Lucentis. The Entyvio sales reflect both U.S. and Non-U.S. sales.
For each of the top 12 MFN drugs, U.S. sales comprised at least half of the total global sales of the drug; for several of these drugs, roughly half of the total U.S. market for the drug would have been subject to MFN pricing under the original CMMI model. For instance, based on our analysis, actual Medicare Part B spending (based on ASP) represented 48% of 2021 U.S. sales for Keytruda and more than half of U.S. sales for Eylea and Prolia/ Xgeva (57% and 51%, respectively). Moreover, the majority (68%) of Lucentis’s U.S. market would have been subject to MFN pricing. For other drugs, such as Ocrevus (16%) and Alimta (31%), Medicare Part B represented a minority of their domestic sales; therefore, the U.S. market for these drugs would have had a smaller relative impact under the original MFN model.
Considerations for MFN and International Reference Pricing Models
With the re-emergence of MFN pricing as a policy objective under the current administration, the savings estimates from our analysis may provide insights into the potential impacts of forthcoming MFN approaches. Notably, the MFN payment amounts we used were determined based on the original model’s phased-in approach to calculating the MFN payment amount, using a blend of 75% of the ASP and 25% of the MFN price. If implementation deviates from prior practice, such as using a more aggressive phase-in approach or a different blending formula weighted more heavily toward the MFN price were used, the model impact would change.
International reference pricing presents the potential for short-term savings, but several researchers have cited scenarios that may affect savings in the longer term. For instance, manufacturers may delay the launch of drugs in countries comprising the reference price basket to try to maximize revenues until the reference price can be effectuated or, in an even more extreme scenario, exit markets in reference countries with the lowest prices to maintain higher U.S. prices,[6] which could present access challenges. Manufacturers may also increase list prices for new launches in reference countries to push up U.S. prices, driving up the benchmarked prices across countries.[7]
Moreover, the actual impact of U.S. adoption of international reference pricing could be muted since reference prices rely on list prices and countries often negotiate confidential discounts off list prices, which would not be reflected in the reference prices. Notably, countries that have adopted reference pricing typically use it in combination with other tools, such as health technology assessment for value-based pricing, which aims to align prices with the health impact of new drugs or by weighting the reference price with the prices for comparator therapies.[8]
[1] The claims were accessed via the CMS Virtual Research Data Center. We analyzed 2021 data because the MFN payment amounts originally determined for the rescinded MFN model were calculated for 2021. However, the MFN payment amounts were only published for Quarter 1 (Q1) 2021 instead of the entire calendar year (CY), so we trended the MFN payment amounts to subsequent quarters using the CY 2021 observed weighted ASP trend.
[2] We excluded claims for certain provider types (cancer hospitals, critical access hospitals, rural health clinics, federally qualified health clinics, and Indian Health Service facilities), claims for which Medicare was not the primary payer, claims for providers in the state of Maryland, and claims without a positive claim payment amount or positive total line payment amount.
[3] This add-on was determined by CMS, and we trended forward for subsequent quarters based on methodology specified in the interim final rule (https://www.federalregister.gov/d/2020-26037/p-286) under § 513.220.
[4] The claim-reported Medicare allowed amount may not match the ASP payment limit in situations where the drug is bundled under the Outpatient Prospective Payment System, if vials are only partially used (i.e., discarded drugs), due to local Medicare Administrative Contractor pricing adjustments, etc.
[5] Drug class was assigned using the World Health Organization’s Anatomical Therapeutic Chemical classification system.
[6] Ollendorf, D. A., Synnott, P. G., & Neumann, P. G. (2021, May 27). External reference pricing: The drug-pricing reform America needs? The Commonwealth Fund, Issue Brief.
[7] Rand, L. Z., & Kesselheim, A. S. (2021). International reference pricing for prescription drugs in the United States: Administrative limitations and collateral effects. Value in Health, 24(4), 473-476. https://doi.org/10.1016/j.jval.2020.11.009.
[8] Ibid.
Disclaimer: This piece was written by Shalini Parekh (Director, Economics) and Marisa Aurora (Research Economist) to share perspectives on a topic of interest. Expression of opinions within are those of the author or authors.


